

- Rising bets on a Trump victory warrant a closer examination of its impact on fixed income markets
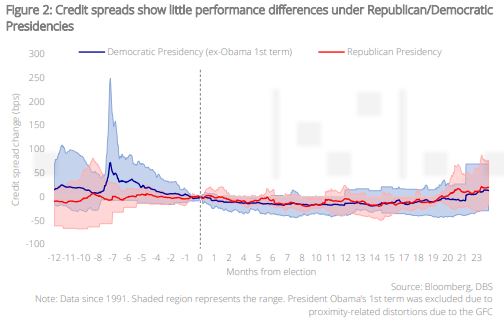
- Historically, there have been limited differences in credit spreads between Democratic and Republican presidencies. In both cases, credit spreads appear to tighten over the 12 months after elections
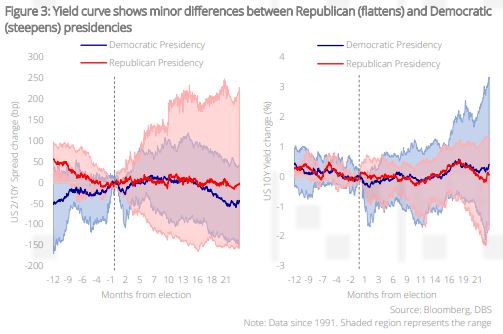
- UST curves exhibit gradual flattening under past Republican presidencies but gradual steepening under past Democratic presidencies. 10Y UST yields appear to inhabit lower ranges under Republican presidencies, contradicting market consensus of a hypothetical Trump presidency
- In addition, the prospect of growth-hampering tariffs and muted tax cuts may not be conducive for higher yields. Fixed income investors should continue to switch from cash to bonds should higher yields present themselves in anticipation of a Trump victory
Related Insights
- DBS Stock Pulse: (1) Global Technology - Smartphone market optimism and AI phone launches: Who’s poised to win? (2) Singapore REITs - Possible liquidity boost from T-Bill investors turning to REITs30 Aug 2024
- Fixed Income Weekly: Asia Takes Cue from Powell’s Pivot 29 Aug 2024
- Research Library29 Aug 2024

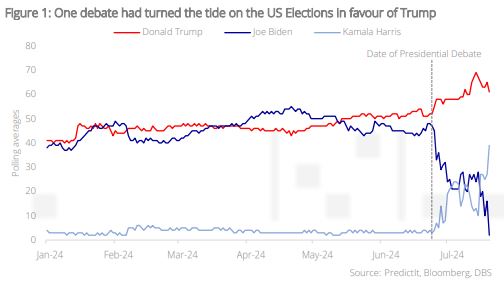
Turning of the tides. It takes only moments to alter destinies – incumbent President Joe Biden’s poor showing in the Presidential debates has led to an abrupt end in his bid for re-election. What was initially a tight toss-up between two leading candidates has now evolved into a clear lead by the Republican nominee Donald Trump. Even then, he was not without his own destiny-altering moment; the ex-President had to literally dodge a bullet in a botched assassination attempt to take pole position in this presidential race. Now that the dust has settled, it is perhaps a little safer for fixed income investors to look ahead to ascertain what a second Trump administration might imply for the markets.
Elections themselves have limited impact on credit risk. Quantitatively, the first thing to note is that credit spreads show little variance between a Republican or Democratic presidency; an intuitive observation given that other factors (corporate balance sheet strength, profitability, monetary policy, liquidity etc.) have a larger and more direct influence on spreads. Interestingly, under both sides, spreads exhibit a tendency to decline in the 12 months after elections – likely as the markets are relieved of a key quadrennial risk event.
Presidencies and the yield curve. The yield curve however does seem to show slight differences – Under Republican presidencies, curves appear to flatten in the one-year period before and after elections, while democratic presidencies see steepening in the same timeframe. Once again, the data on average shows little discrepancy between Republican or Democratic presidencies, but it is interesting to note that the ranges can be quite variable – for example, the 10Y UST yield under Republican presidencies appear to inhabit a lower range of yields two years after elections, while the range under Democratic presidencies appears quite wide.
This runs against the current consensus that a second Trump regime would almost certainly lead to higher 10Y yields due to runaway deficits and debt; one would recall that it is in fact the Republican party that historically leans towards fiscal conservatism (referencing the “Tea Party” movement of 2009). These consensus assumptions therefore warrant further investigation.
Would a Trump presidency lead to higher yields? Conventional assumptions remain that a second Trump term would pave the way for another round of unfunded corporate tax cuts, potentially aggravating the runaway US federal government debt problem that the US Congressional Budget Office (CBO) projects to reach 166% of GDP by 2054. We encourage investors to take a slightly contrarian view, given that Trump’s second term could look quite different from his first for a few reasons:
- It is difficult to cut corporate taxes much further from here. The 2017 Tax Cuts and Jobs Act (TCJA) permanently reduced corporate tax rates from 35% to 21%. To reduce taxes by the same magnitude again would be extremely difficult, seeing that those savings did not go as far towards domestic investment as they did to fund share buybacks. It would also be much more unpopular to Trump’s voter base today to reduce taxes for multinational corporations with a liberal bias.
- Trump prefers lower rates. In his first presidential term, Donald Trump was not uncomfortable with blurring the lines on Fed independence, overtly criticising the Fed on social media for aggressively raising rates during his term as president. With policy rates today nearly double those of his first term, it is difficult to imagine that he would be more comfortable about it now. Seeing as interest payments are a large contribution to the CBO’s debt projections, this could help to partly arrest the deficit spiral.
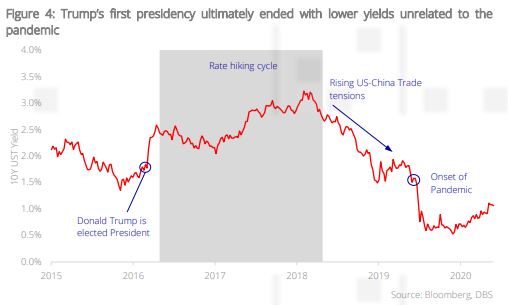
- Tariffs would put a lid on potential growth of the economy. While tariffs are inflationary and could encourage re-shoring of manufacturing activity, we note that it does still result in efficiency losses that decreases potential economic growth which can ultimately lead to lower bond yields. Trump’s first term is illustrative – while tax cuts did initially supercharge expectations of strong growth and provided cover for a Fed hiking cycle, tariffs and trade tensions eventually dampened the global outlook which resulted in 10Y UST yields falling all the way down to c.1.5% even before the pandemic.
A Trump presidency is not bond Kryptonite. Based on the above, we believe that a Trump presidency may not lead to the higher-and-higher yield environment that fixed income investors fear; investors should therefore capitalise on any spike in yields to switch from cash into bonds as we pivot towards a cutting cycle in global monetary policy.
Topic
The information published by DBS Bank Ltd. (company registration no.: 196800306E) (“DBS”) is for information only. It is based on information or opinions obtained from sources believed to be reliable (but which have not been independently verified by DBS, its related companies and affiliates (“DBS Group”)) and to the maximum extent permitted by law, DBS Group does not make any representation or warranty (express or implied) as to its accuracy, completeness, timeliness or correctness for any particular purpose. Opinions and estimates are subject to change without notice. The publication and distribution of the information does not constitute nor does it imply any form of endorsement by DBS Group of any person, entity, services or products described or appearing in the information. Any past performance, projection, forecast or simulation of results is not necessarily indicative of the future or likely performance of any investment or securities. Foreign exchange transactions involve risks. You should note that fluctuations in foreign exchange rates may result in losses. You may wish to seek your own independent financial, tax, or legal advice or make such independent investigations as you consider necessary or appropriate.
The information published is not and does not constitute or form part of any offer, recommendation, invitation or solicitation to subscribe to or to enter into any transaction; nor is it calculated to invite, nor does it permit the making of offers to the public to subscribe to or enter into any transaction in any jurisdiction or country in which such offer, recommendation, invitation or solicitation is not authorised or to any person to whom it is unlawful to make such offer, recommendation, invitation or solicitation or where such offer, recommendation, invitation or solicitation would be contrary to law or regulation or which would subject DBS Group to any registration requirement within such jurisdiction or country, and should not be viewed as such. Without prejudice to the generality of the foregoing, the information, services or products described or appearing in the information are not specifically intended for or specifically targeted at the public in any specific jurisdiction.
The information is the property of DBS and is protected by applicable intellectual property laws. No reproduction, transmission, sale, distribution, publication, broadcast, circulation, modification, dissemination, or commercial exploitation such information in any manner (including electronic, print or other media now known or hereafter developed) is permitted.
DBS Group and its respective directors, officers and/or employees may have positions or other interests in, and may effect transactions in securities mentioned and may also perform or seek to perform broking, investment banking and other banking or financial services to any persons or entities mentioned.
To the maximum extent permitted by law, DBS Group accepts no liability for any losses or damages (including direct, special, indirect, consequential, incidental or loss of profits) of any kind arising from or in connection with any reliance and/or use of the information (including any error, omission or misstatement, negligent or otherwise) or further communication, even if DBS Group has been advised of the possibility thereof.
The information is not intended for distribution to, or use by, any person or entity in any jurisdiction or country where such distribution or use would be contrary to law or regulation. The information is distributed (a) in Singapore, by DBS Bank Ltd.; (b) in China, by DBS Bank (China) Ltd; (c) in Hong Kong, by DBS Bank (Hong Kong) Limited; (d) in Taiwan, by DBS Bank (Taiwan) Ltd; (e) in Indonesia, by PT DBS Indonesia; and (f) in India, by DBS Bank Ltd, Mumbai Branch.
Related Insights
- DBS Stock Pulse: (1) Global Technology - Smartphone market optimism and AI phone launches: Who’s poised to win? (2) Singapore REITs - Possible liquidity boost from T-Bill investors turning to REITs30 Aug 2024
- Fixed Income Weekly: Asia Takes Cue from Powell’s Pivot 29 Aug 2024
- Research Library29 Aug 2024