

- Bonds out perform Cash after a rate pause; the coming Fed pause gives investors confidence to deploy Cash into Bonds
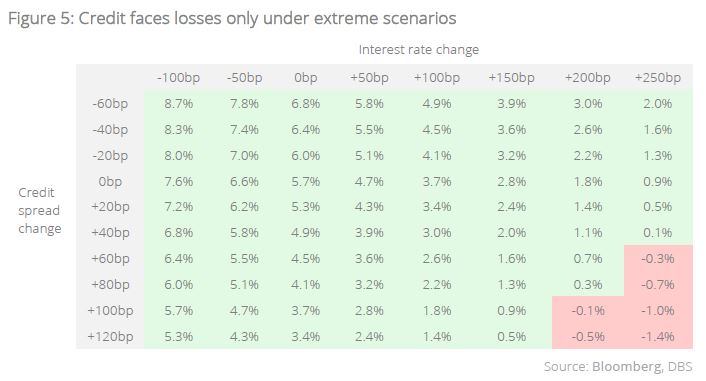
- Credit performs well under stress testing; interest rates need to rise by more than 200 bps, and credit spreads concurrently widen more than 80 bps, for short-duration IG Credit to run into losses over a one-year time frame
- Bonds now offer more optionality than Cash after a rate pause as reinvestment risk now exceeds duration risk
- Continue to take the opportunity to switch from Cash to short-term Credit; sweet spot remains with A/BBB Creditin the 3-5Y duration segment
- Bright spots remain with a) bank capital instruments that still trade fairly wide, and b) high quality EM credit and Local Currency Bonds that could benefit under diminishing USD strength

Related insights

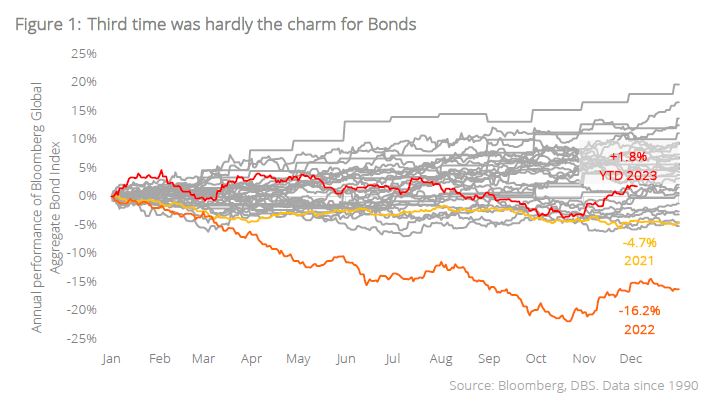
It was supposed to be the year for Bonds.Investors entered 2023 with no shortage of reasons to be risk-averse, with (a) the US Federal Reserve maintaining its hawkish push even after a 50 bps hike in Dec 2022, (b) early signs of cracks in the mid-sized banks nursing deep paper losses on their balance sheet yield-assets, and (c) no signs of an only did the Fed raise rates by another 100 bps, several banks on both sides of the Atlantic failed, and a new front of war developed in the Middle East. Moreover, recessionary expectations in 2023 rose to the highest levels since the onset of the Covid pandemic. Just on these developments alone, one would have thought that Bonds would have been the standout performer for the year.
Expectations far from reality.Yet in stark contrast to market expectations, it was risk markets that performed incredibly. The US S&P and NASDAQ indices – led by the performances of the large-cap defying gains. HY Bonds not only paid huge coupons; spreads had on aggregate tightened back in line with their 5Y averages. Even Bitcoin, the infamously volatile cryptocurrency, saw a c.150% increase “safer” Fixed Income instruments – represented by the Bloomberg Global Aggregate Bond Index – faced a YTD gain of c.1.8%, underperforming Cash. Considering that the index already suffered declines of -4.7% in 2021 and -16.2% in 2022, mean reversion hardly came to the rescue for Fixed Income investors in 2023.
Duration was the danger. Peeling back the layers of performance attribution showed that a lot of the decline was contributed by duration-related losses, especially during the sharp steepening in the yield curve at the turn of 2H23. We had highlighted this risk in the 2023 3Q and 4Q Global Credit outlook pieces, and had advocated a short-duration, high quality credit portfolio termed the Liquid+ Strategy for the whole of the year in view of these concerns we had acknowledged. Despite generally tepid performances in Fixed Income in 2023, the strategy did ultimately offer investors good risk-adjusted positive returns for the year.
Where do we go from here? We believe that the dearth of demand for Bonds was amplified not so much by the gains had on Equities, but because of the allure of Cash. After all, for income-generating allocations, it is difficult to imagine why one would move out of the certainty offered by Cash – into Bonds – when yield differentials are insignificant. Now while that may have been true for the years 2022-2023, we believe more serious considerations for Bonds need to be had in 2024 now that the long-awaited Fed policy pause is coming into effect.
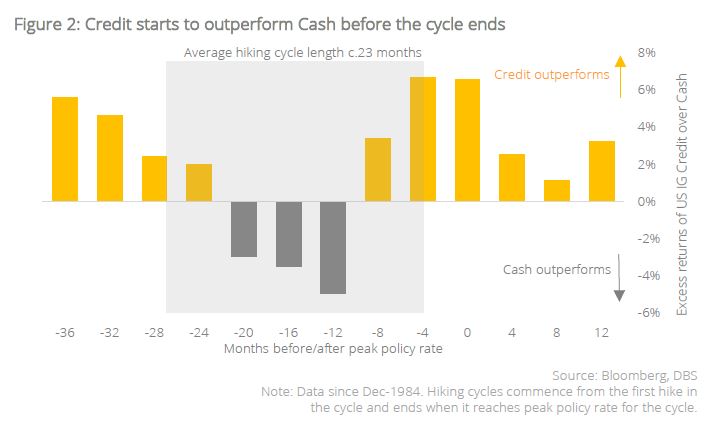
Cash has already had its day. We looked at performance data since 1984 comparing the 1Y forward excess returns of US IG Credit over Cash both before and after the policy rate peaks. What we noticed is that Cash is the better bet early in the hiking cycle – 12 to 20 months before the pause. However, investors need not wait for rates to peak before Credit starts to outperform. This is because markets usually move in advance of the policy cycle; funds flow before the end of the policy cycle in order to lock in higher yields for longer. Our analysis shows that Credit outperformance can even begin as early as four to eight months before the cycle ends. Having seen cash returns surpass Credit in 2022-2023, following a typical cycle implies that outperformance in Credit is no longer difficult to achieve from 2024 onwards.
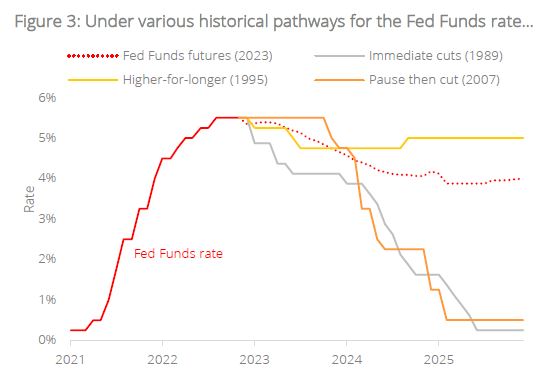
Performing a scenario analysis with various rate trajectories. No doubt, the choruses of “higher-for-longer” raise the notion that yields on Cash may still offer a compelling alternative to Bonds for a long while to come. As such, to anticipate the performance of Credit vs Cash in the years ahead, we projected the possible pathways of the Fed Funds rate over the next three years under four scenarios mimicking historical episodes, including the pathways of (a) immediate cuts – following the 1989 pause, (b) higher-for-longer rates – mimicking the 1995 pathway, (c) pause then cut – such as in 2007, as well as (d) using the current Fed Funds futures projections. We then compared the expected annualised returns of Credit vs Cash based on the anticipated yield movements.
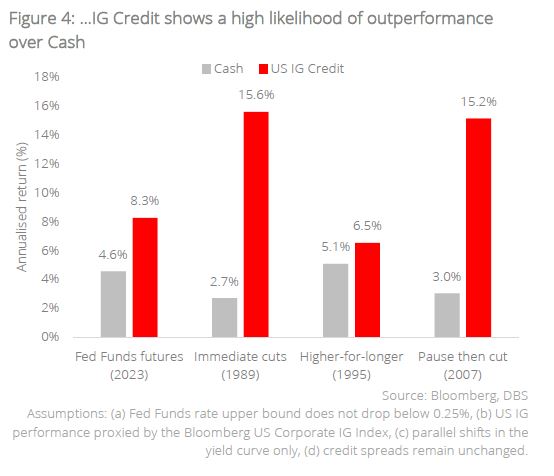
Credit outperforms Cash over various scenarios. Notably, Credit outperforms across all these various precedent scenarios after a pause as illustrated above. It is remarkable to consider that even in the higher-for-longer scenario following the 1990s pathway, Credit still ekes out marginal gains over Cash.
Credit also performs well under stress testing. With much uncertainty around the investment climate, investors may still feel that taking neither duration nor credit risks in Cash is preferred, given that return of capital is now a greater priority than return on capital. However, given that starting yields on broad swathes of the short-duration high-quality credit markets are now yielding close to 6%, it would take very extreme cases of rate rises and/or spread widening for an investor to end up with losses over a one-year horizon.
By our estimates, interest rates need to rise by more than 200 bps, and credit spreads concurrently widen more than 80 bps, for short-duration IG Credit to run into losses over a one-year timeframe. This in itself is an unlikely scenario. Typically, widening spreads are symptomatic of a weakening economy, which negates the need for higher rates. Conversely, if rates do push higher because of strong growth, credit spreads should remain well-behaved. It would be abnormal to see a prolonged period of both higher rates and wider spreads.
Bonds give more optionality after a rate pause. Most importantly, Bonds now offer more optionality than Cash after a rate pause as reinvestment risk now exceeds duration risk. A policy pause implies that the future direction of interest rates is more likely to be flat/down than up. So, if rates (a) stay higher-for-longer, short-duration IG Credit would earn a higher spread than Cash, while (b) a rate-cutting cycle would see potential for capital gains in Bonds – optionality that is not present in Cash.
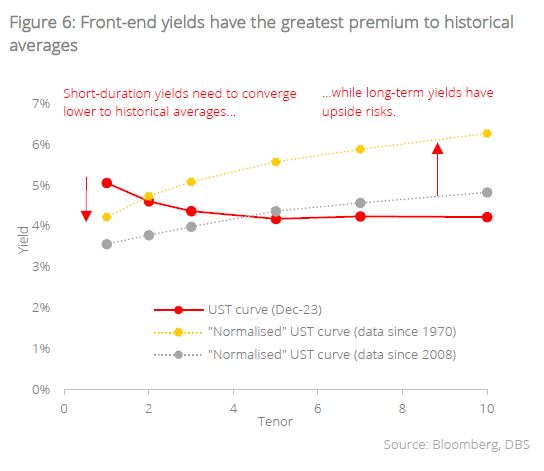
Why not then just lock in long-term Bonds for this optionality? The issue becomes more complicated when one considers not whether to lock in duration, but how far to take duration risk before it eclipses potential returns. This brings us to consider what a “normalised” yield curve should look like under more typical conditions where (a) the curve is upward sloping, (b) policy rates are close to neutral, and (c) inflation expectations are well-anchored. Approximating the shape of this “normalised” yield curve allows us to appreciate the risks within each duration bucket.
How does one estimate a “fair value” for yield? At every point on the yield curve, the nominal yield of a t-year bond could be represented by a summation of the (i) real neutral rate of interest, (ii) inflation expectations over period t and (iii) a term premium that approximates the risk of carrying Bonds for term t. Markets understand that at some level, the post-pandemic environment of zero rates is an anomaly, and some reversion to historical levels had to eventually occur. We therefore used long-term averages of each of these three components using both (1) data since 1970 (for long-term comparisons) and (2)data since 2008 (should the post-GFC secular stagnation environment prevail in theyears ahead) to observe where mean reversion could take us.
Under both instances, the “normalised” yield curves are upward sloping, and it is interesting to note that front-end yields are still much higher than historical averages, while longer-term yields could see more upside risk should mean reversion occur. The sweet spot for duration seems to remain in the 3-5Y segment of the curve.
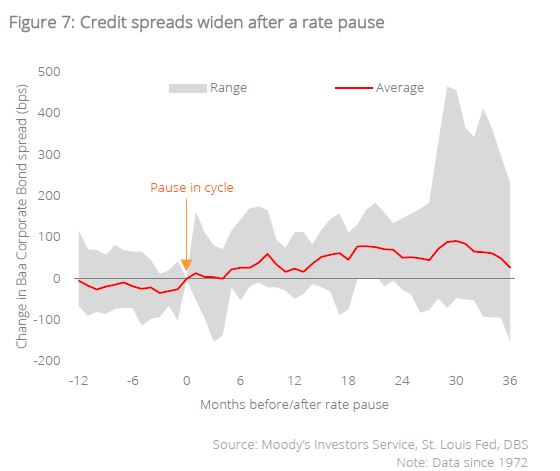
Take caution on credit risks. Investors should also remain cautious with credit risks following a rate pause. While it is intuitive to think that headwinds should abate after a pause in the cycle, the data seems to suggest that credit risks can accumulate beneath the surface even after a peak in rates. Looking at aggregate spread data since 1972, we note that credit spreads on average continue to widen after the pause, likely due to stresses in companies adjusting to higher funding costs and tighter lending conditions. This leads us to continue to favour IG over HY for 2024, with the A/BBB segment remaining the sweet spot for Credit.
Bright spots in Credit. At this juncture, there are a couple of bright spots in Credit worth highlighting:
A.AT1 Bank Capital instruments
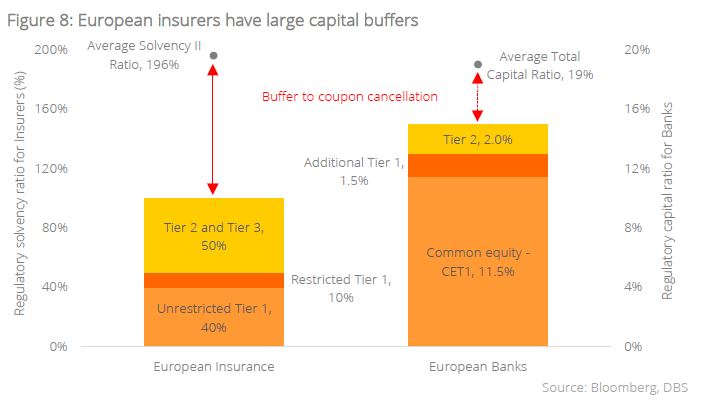
Sentiment around bank capital paper took a huge hit earlier in 2023 from the fallout of high-profile bank collapses in both the US and Switzerland, with investors starting to believe that subordinated AT1 instruments should be more Equity- than Bond-like given the risks involved. While there is truth to this, we also believe that since such bank collapses did not lead to worldwide financial dysfunction, such capital instruments did serve their purpose of preventing idiosyncratic risks from becoming systemic.
At present, financial contingent capital instruments are still yielding close to 9%, with valuations still wide of corporate equivalents; implying that there could be value in this space. Fundamentally, many European banks are still maintaining adequate capital buffers against regulatory requirements, which means that the sector remains in good health. We would however, maintain a preference for quality IG issuers even for financials, given that we could be late in the credit cycle.
B.EM Credit and Local Currency Bonds
A Fed pause also usually marks the end of sustained USD strength. As such, green shoots are likely to emerge in local currency EM Bonds, as USD funding tightness abates while potential alpha comes in the form of FX gains on top of their high yields. In Hard Currency Credit, we also believe that there are opportunities in high quality EM Bonds in Asia, as well as IG commodity exporters in the Middle East/LatAm that will continue to benefit from stable global demand for materials and energy.
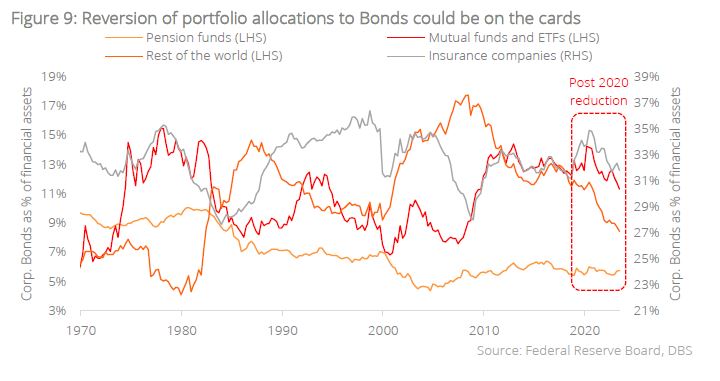
Bond allocations could turn favourable in 2024. Finally, a structural tailwind for Credit could come in the form of revised portfolio allocations from real money accounts around the world. We note that asset managers have been reducing portfolio allocations to Bonds in the low-yielding post-pandemic years. The sharp rise in yields post hiking-cycle could see higher allocations and overweight calls return for Fixed Income, resulting in a tailwind of fund flows in support of Bonds at the turn of the year.
In summary, we believe that the coming Fed pause gives confidence to deploy Cash into Bonds. Investors should continue to take the opportunity to switch from Cash to short-term Credit; the sweet spot remaining with A/BBB Credit in the 3-5Y duration segment. Certain bright spots in Credit also remain with (a) bank capital instruments that still trade fairly wide, and (b) high quality EM Credit and Local Currency Bonds that could benefit under diminishing USD strength.
Topic
The information published by DBS Bank Ltd. (company registration no.: 196800306E) (“DBS”) is for information only. It is based on information or opinions obtained from sources believed to be reliable (but which have not been independently verified by DBS, its related companies and affiliates (“DBS Group”)) and to the maximum extent permitted by law, DBS Group does not make any representation or warranty (express or implied) as to its accuracy, completeness, timeliness or correctness for any particular purpose. Opinions and estimates are subject to change without notice. The publication and distribution of the information does not constitute nor does it imply any form of endorsement by DBS Group of any person, entity, services or products described or appearing in the information. Any past performance, projection, forecast or simulation of results is not necessarily indicative of the future or likely performance of any investment or securities. Foreign exchange transactions involve risks. You should note that fluctuations in foreign exchange rates may result in losses. You may wish to seek your own independent financial, tax, or legal advice or make such independent investigations as you consider necessary or appropriate.
The information published is not and does not constitute or form part of any offer, recommendation, invitation or solicitation to subscribe to or to enter into any transaction; nor is it calculated to invite, nor does it permit the making of offers to the public to subscribe to or enter into any transaction in any jurisdiction or country in which such offer, recommendation, invitation or solicitation is not authorised or to any person to whom it is unlawful to make such offer, recommendation, invitation or solicitation or where such offer, recommendation, invitation or solicitation would be contrary to law or regulation or which would subject DBS Group to any registration requirement within such jurisdiction or country, and should not be viewed as such. Without prejudice to the generality of the foregoing, the information, services or products described or appearing in the information are not specifically intended for or specifically targeted at the public in any specific jurisdiction.
The information is the property of DBS and is protected by applicable intellectual property laws. No reproduction, transmission, sale, distribution, publication, broadcast, circulation, modification, dissemination, or commercial exploitation such information in any manner (including electronic, print or other media now known or hereafter developed) is permitted.
DBS Group and its respective directors, officers and/or employees may have positions or other interests in, and may effect transactions in securities mentioned and may also perform or seek to perform broking, investment banking and other banking or financial services to any persons or entities mentioned.
To the maximum extent permitted by law, DBS Group accepts no liability for any losses or damages (including direct, special, indirect, consequential, incidental or loss of profits) of any kind arising from or in connection with any reliance and/or use of the information (including any error, omission or misstatement, negligent or otherwise) or further communication, even if DBS Group has been advised of the possibility thereof.
The information is not intended for distribution to, or use by, any person or entity in any jurisdiction or country where such distribution or use would be contrary to law or regulation. The information is distributed (a) in Singapore, by DBS Bank Ltd.; (b) in China, by DBS Bank (China) Ltd; (c) in Hong Kong, by DBS Bank (Hong Kong) Limited; (d) in Taiwan, by DBS Bank (Taiwan) Ltd; (e) in Indonesia, by PT DBS Indonesia; and (f) in India, by DBS Bank Ltd, Mumbai Branch.